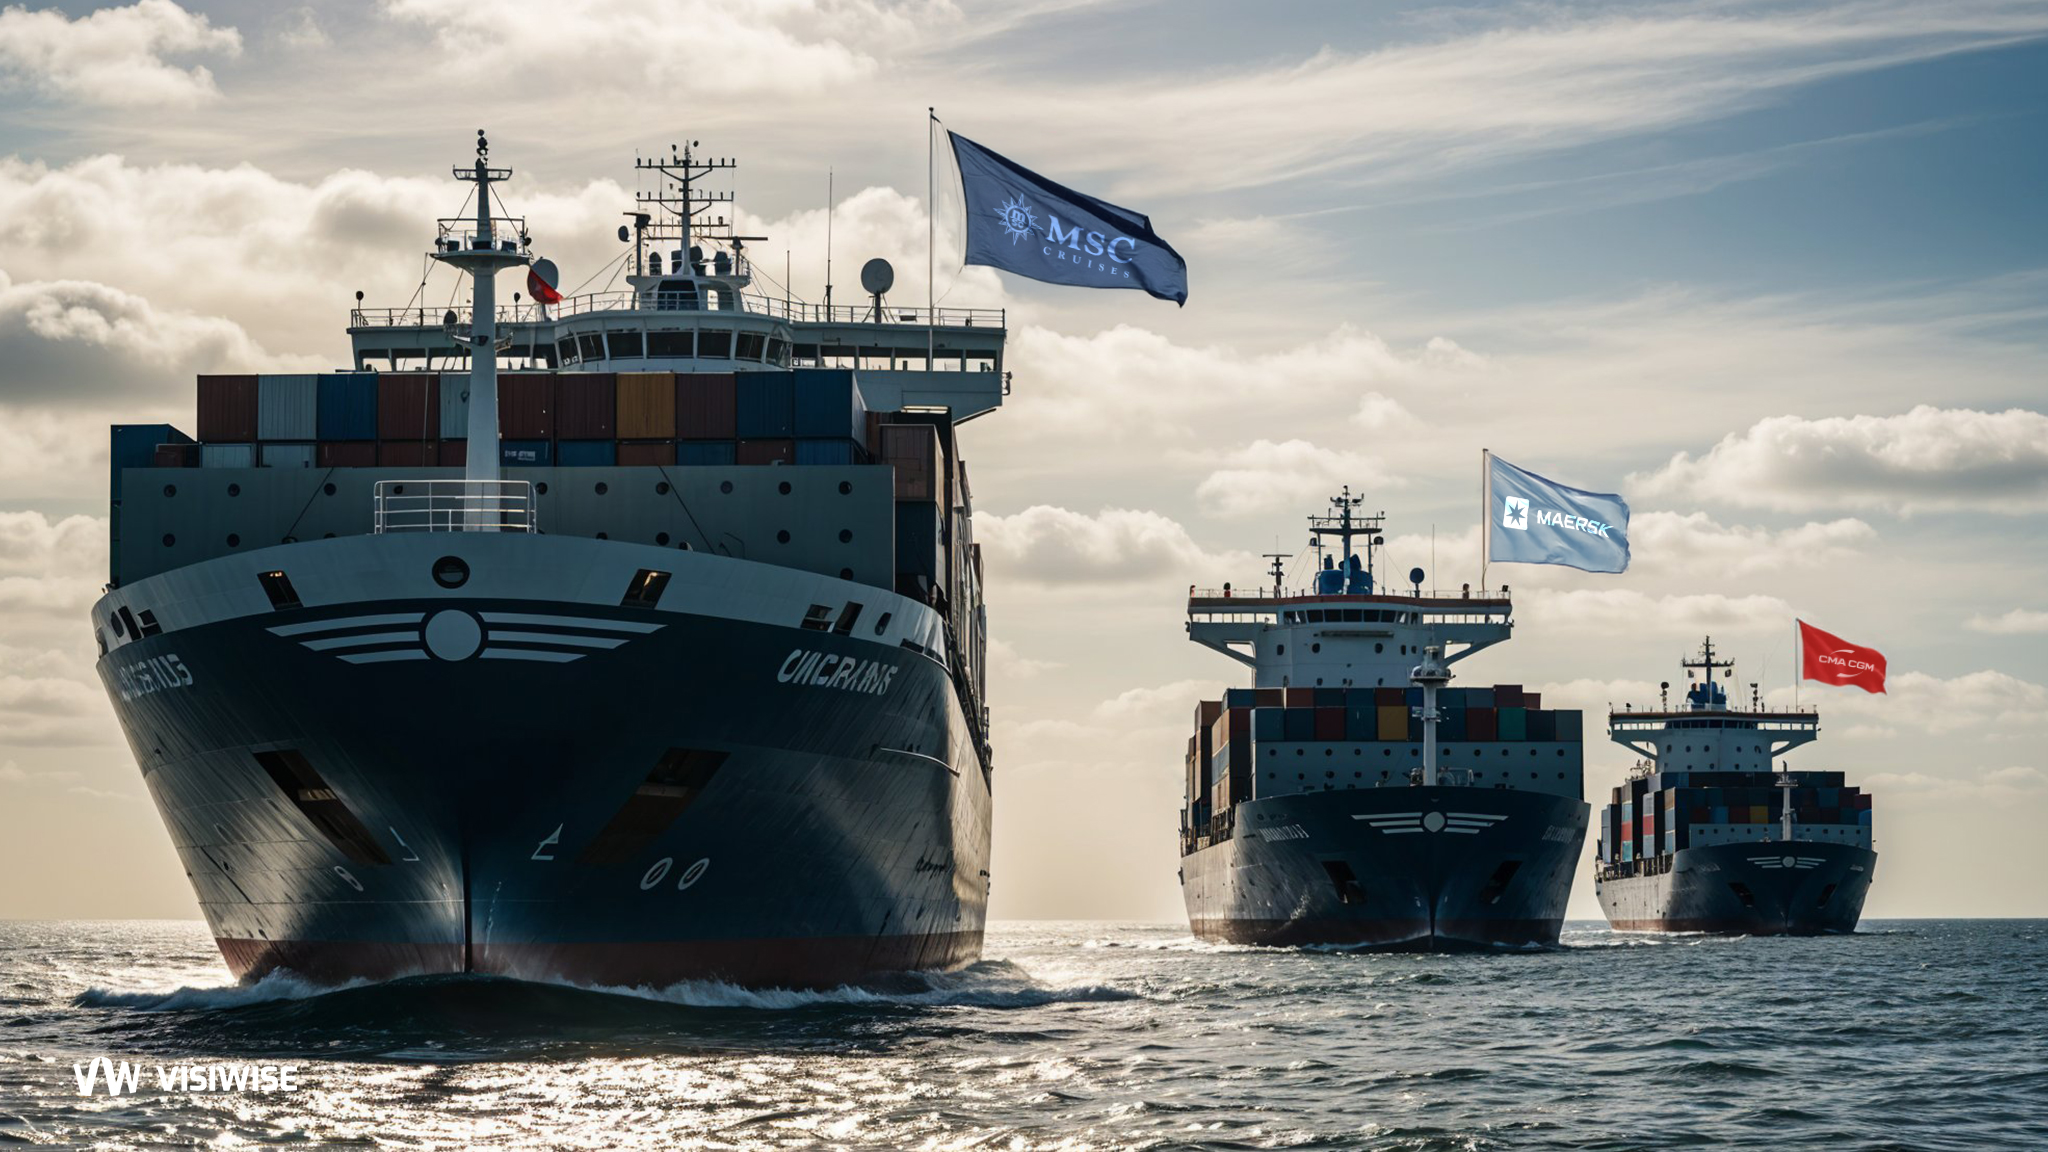
Container shipping in 2025 faces strong market shifts, capacity changes, and ongoing Red Sea disruptions. Despite uncertainty, major carriers have adapted, with some posting strong profits and expanding fleets. This blog post highlights the top ten container shipping companies in 2025, examining their capacity, strategies, and challenges in the current global market.
2025 Container Shipping Outlook: Navigating the Crosscurrents
Market Shifts and Unexpected Developments
In early 2024, approximately 3 million 20-foot-equivalent units (TEU) in new capacity were poised to come online after three years of controlled capital spending. Carriers anticipated a return to chronic overcapacity, which has historically weighed on the industry’s profitability. However, market fundamentals changed drastically in November 2023 when Houthi rebels in Yemen launched a campaign of attacks on Red Sea shipping. Virtually overnight, 7–8% of global capacity was diverted as Red Sea cargoes were rerouted around the Cape of Good Hope, adding two weeks to transit times along the Far East-Europe lane and resulting in a 40% increase in emissions.
The Profit Turnaround
The detour drained the market of excess capacity, and tight supply drove rates upward, with the China Containerized Freight Index rising up to 150% from the start of the crisis to July 2024. Thanks to the rate increases, carriers that expected to post annual losses ended the year strongly profitable. For instance, Maersk issued guidance in February 2024 expecting annual losses of up to $5 billion; by October 2024, it had alerted investors to expect EBIT of up to $5.7 billion. The final tally, reported in February 2025, was $6.5 billion in EBIT. Hapag-Lloyd, which in March 2024 warned of losses of up to $1.1 billion, posted $2.8 billion in EBIT.
Operational Readiness and Industry Resilience
Rather than trying to predict future developments, container shipping stakeholders might better focus on maintaining a high level of operational readiness. Strong crosscurrents are buffeting the industry, and the advantage will go to operators capable of adjusting rapidly and efficiently to fast-changing conditions. Can carriers sustain their strong performance in 2025? Much depends on the timing of a resolution to the Red Sea crisis. The Houthis’ January 20 announcement that they would limit their attacks to Israeli-flagged carriers has not sparked a stampede back to the region by other carriers.
Capacity and Alliances
The industry consensus—that there will be no resolution in the first half of the year—has not shifted. Whenever the crisis is resolved, the return of diverted capacity and the addition of a massive supply of newbuilds could swamp the supply-demand balance, drive rates down, and tip profits into losses. Adding to the uncertainty are two developments whose impacts on the shipping market remain to be seen: the emergence in 2025 of newly configured shipping alliances and the imposition of tariffs by the new U.S. administration.
From three alliances as of the end of 2024, the industry will reshuffle into three alliances plus one go-it-alone operator, MSC. The shift will reduce market concentration significantly. Add in a 9–10% increase in capacity, and it’s clear that the reopening of the Red Sea would trigger a step-change in competition to “fill the ship.”
The Gemini Cooperation and Its Impact
At least as important as the new alliances’ effect on rates is the impact that the Gemini Cooperation’s operating model—which moves cargoes through a hub-and-spoke network rather than sailing port-to-port—could have on how carriers do business. If alliance members successfully execute their strategy and fulfill their promise to rapidly achieve 90% reliability with their hub-and-spoke model, they could offer carriers a viable alternative to port-to-port sailings. The effect on container shipping operations could be nothing short of revolutionary.
Financial Standing of Major Carriers
The 15 liner companies in our sample remain in sound condition despite the retreat in revenues from the high of 2022. The carriers posted aggregate 2024 EBITDA of $36 billion, up from $23 billion the prior year, a margin of 19%, as against 15% in 2023. Cash reserves shrank for the second time since 2019, ending the year around $70 billion, down from $73 billion at the end of 2023. Yet the $20 billion in CapEx investments reported by the companies in our sample was one of the largest annual outlays in history.
Capacity Expansion and Ordering Trends
Prior to the outbreak of the Red Sea crisis, carriers and shippers alike in 2024 were preoccupied with concerns about overcapacity and its effect on rates. In 2024, total additional ocean capacity rose by nearly 11%, or about 3 million TEU, most of which was absorbed by European trade lanes. Industry-wide, more than 200 new vessels will come online in 2025. After accounting for expected deletions, about 2 million TEU capacity will be added to the fleet, a 6% increase. Global shipping demand, on the other hand, is projected to post only 2–3% growth.
Still more ships are on the way. Carriers ordered a record amount of TEU in 2024—2.3 million in the third quarter and an additional 1.5 million in the fourth. As of January 1, 2025, the industry’s order book stands at 780 vessels, or 8.5 million TEU. MSC was the most aggressive acquirer, reflecting its determination to become the industry’s largest player. The world’s number two operator, Maersk, last year expanded its fleet by 7% after two consecutive years of reductions.
China’s Role in Shipbuilding
China has become the main builder of container vessels, its shipyards accounting for 69% of the TEU capacity in the global order book.
Ocean rates at the outset of 2024 looked set to continue the downward drift that prevailed through much of 2023. But as the attacks in the Red Sea intensified, rates shot upward in the second quarter of the year, peaking in July at a level comparable to the pandemic era before starting to ease at year-end. Reliability bobbed up and down within the 50–55% range in 2024, roughly 10% lower than 2023 and well below the 80% reliability that prevailed through much of 2019.
Reliability and Network Optimization
The Gemini Cooperation says it will improve reliability by reducing the number of port calls to eight or nine large ports where one or the other alliance member controls operations. That operating model increases complexity as well as costs compared with more traditional port-to-port service, but shippers that place a high value on reliability may be willing to accept the higher charges.
Sustainability Challenges
Sustainability, in one form or another, has long been on the agenda of shippers, carriers, local and national governmental authorities, and shipyards. Shippers are now stepping up the pressure on carriers to modify and decarbonize their fleets, with more than 40 large shippers, including Amazon, IKEA, and Nike, forming the Zero Emission Maritime Buyers Alliance (ZEMBA) to increase their leverage over carriers and shipyards. Cleaning up the fleet, though, is a very heavy lift. At present, over 90% of vessels on the water operate on high-emission fuels, mainly bunker fuel. No long-term alternative to bunker fuel has been established as a clear front-runner. Orders for LNG and LNG dual-fuel ships led 2024 demands for alternative-fueled ships, with methanol propulsion systems a distant second. Other items on shippers’ sustainability agenda include noise-limiting measures to protect marine life and improved handling of ballast water to prevent the spread of invasive species.
Looking Ahead: Adapting to Uncertainty
Geopolitical conflict and trade tend to follow each other. Revamped shipping alliances and sharply divergent strategies arrive on the market. Capacity veers from barely adequate to overwhelmed. It’s a turbulent world out there for container shipping stakeholders. With no sure sense of the market’s direction in 2025, the best option for stakeholders is to step up their data and analytics capabilities and get good at course correcting on the fly. Fortune favors the nimble, well-informed, and well-prepared.
Top Ten Shipping Companies In 2025
1. MSC (Mediterranean Shipping Company)
- Scale & Market Position: MSC is the largest container shipping line in 2025 by capacity.
- Fleet & Capacity: Its TEU capacity is over 6.6 million (≈ 20.6 % market share) according to mid‑2025 data.
- Strengths & Strategy:
- Aggressive fleet growth via newbuild orders and acquiring ships.
- Broad global coverage: MSC serves hundreds of ports worldwide.
- Flexibility: As a privately held company, MSC has more agility in decision making (not beholden to public markets).
- Investment in sustainability and ancillary logistics operations (ports, inland transport) to vertically integrate.
- Challenges:
- Handling ultra-large ships, port infrastructure constraints, draft limitations.
- Exposure to fuel price volatility, emissions regulation, disruptions (e.g. Red Sea, canal closures).
- Managing reliability and congestion at big ports.
2. Maersk (A.P. Moller – Maersk)
- Scale & Market Position: Maersk is typically ranked second by capacity, with a strong global presence.
- Fleet & Capacity: As of recent data, Maersk’s fleet capacity is around 4.5 million TEU (or somewhat lower depending on estimates).
- Strengths & Strategy:
- Transition toward being an integrated logistics player (not just ocean shipping) — offering inland transport, warehousing, end-to-end services.
- Strong brand, innovation in digital systems, route reliability.
- Ability to leverage its global network, terminal assets, and intermodal integration.
- Challenges:
- The shift toward logistics can dilute focus on core shipping operations.
- Capital intensity of new vessel orders and balancing supply/demand.
- Maintaining margins amid increasing regulation (carbon, fuel) and geopolitical risks (trade conflicts, route disruptions).
3. CMA CGM
- Scale & Market Position: CMA CGM holds the third position in many rankings of 2025.
- Fleet & Capacity: Its capacity is several million TEUs (various estimates ~3.9 million).
- Strengths & Strategy:
- Diversification into logistics, terminals, inland services — moving toward integrated supply chains.
- Active investments in digitalization and sustainability (alternative fuels, emissions reduction).
- Strong presence in Africa, South America, and emerging markets.
- Challenges:
- Heavy investment in non‑shipping arms (logistics, terminals) carries risk if trade slows.
- Global trade volatility, regulation, fuel cost inflation.
- Competitive pressure from state‑backed carriers.
4. COSCO Shipping Group
- Scale & Market Position: COSCO is one of China’s flagship carriers and ranks among the top four globally.
- Fleet & Capacity: Capacity in the range of 3.3 million TEU (or similar) depending on data source.
- Strengths & Strategy:
- Strong backing from the Chinese state, enabling investments in ports, terminals, and global infrastructure.
- Integration with port and terminal operations (vertical strength).
- Advantage in Asia–Europe, intra‑Asia, and linking China’s Belt & Road trade corridors.
- Challenges:
- Sensitivity to geopolitical tensions (esp. U.S.–China trade policies).
- Regulatory scrutiny of Chinese state‑affiliated carriers.
- Managing fleet growth and ensuring efficiency in service, while also meeting emissions/green mandates.
5. Hapag‑Lloyd
- Scale & Market Position: Hapag‑Lloyd consistently ranks among the top five.
- Fleet & Capacity: Capacity around 2.4 million TEU in 2025 estimates.
- Strengths & Strategy:
- Strong reputation for reliability, quality of service, and stability.
- Deep roots in European trade lanes, transatlantic and Latin American routes.
- Participation in alliances (for route optimization) — as of early 2025, Hapag‑Lloyd partners with Maersk under a new “Gemini” cooperation.
- Emphasis on digital services, customer portals, tracking, and transparency.
- Challenges:
- Its growth is more incremental; less “aggressive expansion” relative to giants.
- Pressure from mega‑carriers in terms of scale, cost efficiency.
- Infrastructure or port constraints for very large vessels when deployed on big routes.
6. ONE (Ocean Network Express)
- Scale & Market Position: ONE is a major player, often ranked 6th in global capacity rankings.
- Background: ONE is a Japanese joint venture combining K Line, MOL, and NYK liner operations.
- Strengths & Strategy:
- Integrated deployment of resources from the merged entities.
- Strong presence in Asia–Europe, transpacific, and regional trades.
- Focus on operational efficiency and alliance cooperation to optimize vessel usage.
- Challenges:
- Still scaling up relative to the top giants.
- Competitive pressure from more diversified carriers.
- Managing cost structures, especially with fuel and regulatory burdens.
7. Evergreen Marine
- Scale & Market Position: Evergreen is among top 7—recognized for its large fleet and consistent service.
- Fleet & Capacity: In 2025 estimates, capacity ~1.8 million TEU.
- Strengths & Strategy:
- Focus on reliability, frequent sailings, building trust on major trade routes.
- Membership or participation in alliances helps expand reach beyond its own fleet.
- Investments in vessel upgrades, fuel efficiency, environmental compliance.
- Challenges:
- Competing against mega‑lines with bigger economies of scale.
- Infrastructure / port constraints for very large ships on certain routes.
- Volatility in freight rates, fuel, and regulatory changes.
9. Yang Ming (Yang Ming Marine Transport)
- Scale & Market Position: Yang Ming (Taiwan) is commonly in the top 10 by capacity in 2025.
- Fleet & Capacity: Capacity commonly estimated in the ~700,000 TEU range in recent data.
- Strengths & Strategy:
- Strong regional presence in Asia / Asia–Pacific trade lanes.
- Cooperative alliances to expand global reach.
- Emphasis on reliability, maintaining service frequency, and upgrading fleet for efficiency.
- Challenges:
- Competing with bigger carriers, especially on major trunk routes.
- Infrastructure constraints for deploying very large vessels.
- Managing cost pressures from fuel, crew, and environmental regulation.
10. Orient Overseas Container Line (OOCL)
- Scale & Market Position: Established in 1969, OOCL, based in Hong Kong, is both a container shipping company and a logistics services provider.
- Fleet & Capacity: With over 320 offices in more than 70 nations and a fleet operating over 300 vessels, OOCL’s TEU capacity reaches approximately 565,000 TEUs.
- Strengths & Strategy:
- The company manages crucial container terminals, including the Long Beach Container Terminal and Kaohsiung Container Terminal.
- Focus on operational reliability, efficient service, and technology adoption in fleet and logistics operations.
- Strong presence in transpacific and Asia–Europe routes.
- Challenges:
- Competing with much larger global carriers in terms of capacity and economies of scale.
- Balancing investments in fleet modernization and green initiatives while maintaining profitability.
Global Container Shipping Rankings in an Overview (2025)
| Company | Total Capacity (TEU) | Global Market Share | Ships on Order | Core Strategic Focus |
| MSC | 6,624,809 | 20.6% | 127 | Aggressive fleet expansion and independent operations |
| Maersk | 4,567,747 | 14.2% | 52 | Integrated logistics & decarbonization (e.g., Gemini Cooperation) |
| CMA CGM | 3,949,808 | 12.3% | 97 | Strong LNG-powered fleet growth and global reach |
| COSCO Shipping | 3,369,473 | 10.5% | 69 | State-backed, key in Asia-Europe/Belt & Road trade |
| Hapag-Lloyd | 2,412,697 | 7.5% | 32 | Service reliability (Gemini Cooperation with Maersk) |
| ONE | 2,033,115 | 6.3% | 44 | Operational efficiency within Premier Alliance |
| Evergreen Marine | 1,816,359 | 5.6% | 53 | Fleet expansion & membership in Ocean Alliance |
| HMM | 944,539 | 2.9% | 7 | Ultra-large vessels on long-haul routes in Premier Alliance |
| Yang Ming | 713,101 | 2.2% | 8 | Regional presence in Asia-Pacific via Premier |
| OOCL | 565,000 | 1.5% | N/A | Strong presence on transpacific and Asia–Europe routes |

